
In This Guide...
What is the Reports App?
The reports app is a comprehensive reporting tool that allows you to access a wide variety of data and insights on your postings, jobs, candidates, and more! Visualize data to help improve your hiring strategy with multiple free reports, and premium reports available for purchase.
With Market+* and Competitors+* you can...
- Compare your recruitment performance against competitors and identify areas for improvement.
- Gather detailed competitor insights to better understand their recruitment strategies and differentiate your employer brand
- View live updates of market trends to make informed decisions quickly and stay ahead of industry changes.
*Purchase Required
Reports Video Walkthrough
💡For more video resources, check out Jobtarget Academy!
Accessing the Reports App

You can access the Reports App in one of three ways:
- Click 'Reports' in the JobTarget dashboard.
- Click 'Reports' in the top navigation bar.
- If using JobTarget in an embedded iFrame, click the menu button in the upper right-hand corner, then click 'Reports.'
Performance Reporting
Within the Performance tab of the Reports App there are 3 unique reports available; Advertising Performance, Job Performance, and Media Performance.
Access your desired Performance report by toggling between the 3 sub-tabs located under the 'Performance' tab header.
Advertising Performance Report
The Advertising Performance Report shows the cumulative posting performance across all advertised jobs for the selected date range. The default date range for this report is the last 3 months.
This report can also be filtered by Job Title, Media (Job Site / Product), Division, and Job ID.
Posting Performance...

The first section of the Advertising Performance Report is the Posting Performance Chart. This area chart shows the apps and clicks across all advertised jobs within the selected date range and filters, broken down by day.
Overall Metrics...

The second section of the Advertising Performance Report shows overall performance metrics for all advertised jobs within the selected date range and filters.
Postings |
The total number of postings within the selected date range and matching any applied filters. |
Jobs |
The total number of advertised jobs within the selected date range and matching any applied filters. |
Clicks |
The total number of clicks received across all advertised jobs within the selected date range and matching any applied filters. |
Apps |
The total number of applications received across all advertised jobs within the selected date range and matching any applied filters. |
Average conversion rate. |
The Average conversion rate (click-to-apply ratio) across all advertised jobs within the selected date range and matching any applied filters. |
Advertised Postings...

The third and final section of the Advertising Performance Report is the Advertised Posting Table, which provides a breakdown of all Postings within the selected date range and matching any applied filters.
Each relevant Posting ID will populate as a row in the table with the following information columns;
-
Job ID
-
Job Title
-
Posting ID
-
Media (What site/product the job was advertised to.)
-
Clicks
-
Apps
-
Location
-
Conversion Rate
⬆️ Back To Top
Job Performance Report
The Job Performance report shows the client the individual posting performance of each job that was active during the selected date range. The default date range for this report is the last 3 months.
This report can also be filtered by Job Title, Job ID, or Division.
Job Performance Graph...

The first section of the Job Performance Report is the Job Performance Graph. This bar graph shows the apps and clicks received on each advertised job within the selected date range and applied filters.
Overall Metrics...

The second section of the Job Performance Report shows overall performance metrics for all advertised jobs within the selected date range and filters.
Posted Jobs Table...

Postings |
The total number of postings within the selected date range and matching any applied filters. |
Jobs |
The total number of advertised jobs within the selected date range and matching any applied filters. |
Clicks |
The total number of clicks received across all advertised jobs within the selected date range and matching any applied filters. |
Apps |
The total number of applications received across all advertised jobs within the selected date range and matching any applied filters. |
⬆️ Back To Top
Media Performance Report
The Media Performance report breaks down the performance of each Job Site with active postings during the selected date range. The default date range for this report is the last 3 months.
This reports can also be filtered by division or searched by Media (Job Site) name.
Media Performance Graph...
The first section of the Media Performance Report is the Media Performance Graph. This bar graph shows the apps and clicks received across each advertised job within the selected date range and applied filters, broken down by job site.
Overall Metrics...
The second section of the Media Performance Report shows overall performance metrics for all advertised jobs within the selected date range and filters.
Postings |
The total number of postings within the selected date range and matching any applied filters. |
Clicks |
The total number of clicks received across all advertised jobs within the selected date range and matching any applied filters. |
Clicks Per Post |
The average number of clicks received per Posting ID. |
Apps |
The total number of applications received across all advertised jobs within the selected date range and matching any applied filters. |
Apps Per Post |
The average number of applications received per Posting ID. |
Average Conversion Rate |
The Average conversion rate (click-to-apply ratio) across all advertised jobs within the selected date range and matching any applied filters. |
Media Sites Table...
The third and final section of the Media Performance Report is the Media Sites Table, which provides a breakdown of each Job Site to receive traffic within the selected time frame and matching any applied filters.
Each relevant job site will populate as a row in the table with the following information columns;
-
Media (The name of the job site.)
-
Postings (The total number of Posting IDs to receive traffic on that site during the selected date range.)
-
Clicks
-
Apps
-
Conversion Rate
⬆️ Back To Top
Candidate Reporting
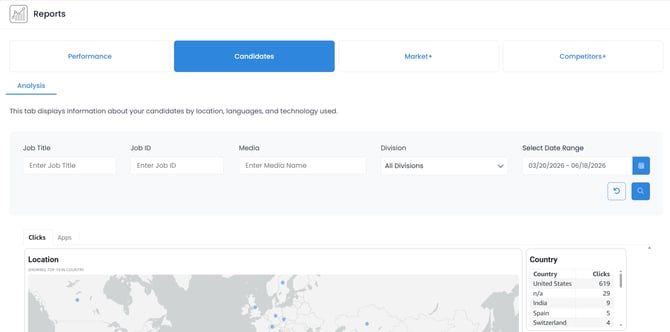
Candidate Analysis Report

The Candidate Analysis Report provides detailed insight into the job seekers who have engaged with your job ads during a selected time frame. This includes information such as location, language, and browsing experience.
Within the Candidates tab of the Reports App there are 2 reports available; Clicks and Apps.
| Clicks | The Clicks Tab in the Candidate Analysis Report shows data for all clicks received on the client’s requisitions during the selected time frame, whether or not an application was received. |
| Apps | The Apps Tab in the Candidate Analysis Report shows data for all job seekers who filled out an application for one of the client’s requisitions during the selected time frame. |
Access your desired Candidates Report view by toggling between the 2 sub-tabs located in the top-left of the reports, just above the map.
These reports can also be searched by Job Title, Job ID, or Media Name, and filtered by Date Range or Division.
Location Map...
The first section of the Candidate Analysis Report is the Location Map, a bubble map showing the location of the candidates who interacted with a job during the selected time frame.
The map can be zoomed and panned to navigate. Hovering over one of the bubbles will display the city name and the number of clicks or apps originating from that location.
Location Details...


The second section of the Candidate Analysis Report is the Location Details. This outlines the number of clicks or apps (depending on which tab you’re in) received in each of the following;
-
Country
-
State
-
City
Language Chart...

The third section of the Candidate Analysis report is the Language Chart, a pie chart breaking down the known languages of the job seekers who interacted with a job during the selected time frame.
Technology Chart...

The fourth and final section of the Candidate Analysis report is the Technology Chart, a pie chart breaking down how many of the relevant candidates interacted with the job on Mobile vs on Desktop.
⬆️ Back To Top
Market+ and Competitors+ Premium Reporting
The Market+ and Competitors+ premium reports (purchase required) provide comprehensive data about job postings in your industry, helping you to benchmark against competitors in your industry.
These reports are both tied to our JobTarget Intelligence (JTI) reporting tools, giving you access to our most in-depth reporting!
Both reports house the same sections, but will show differing data depending on your filters.
Market+ |
The Market+ reports allows you to filter competitor data by 'Title Clusters' to review information based on specific role-types and see how others in your industry are advertising for these positions. This report can also be filtered by date range and location. See also: What are Title Clusters? |
Competitors+ |
The Competitors+ report allows you to filter by competitor company names to review information on how specific competitors in your industry are advertising their positions. This report can also be filtered by date range and location. |
💡Interested in premium reporting? Contact your Relationship Manager today!
Overall Metrics...

The first section of these reports show metrics and data for advertised jobs within your and Date Range and applied filters.
All Postings |
The total number of active job postings within the selected date range and matching any applied filters. |
Open Position |
The total number of relevant job postings that remained open during the entirety of your selected date range. |
Number of Companies |
The total number of companies with postings matching your applied filters and posted during the selected date range. |
Job Postings with Compensation Details |
The percentage of relevant job postings where salary/compensation details were disclosed. |
Average Salary |
The average (Modified Mean) salary across all relevant job postings. |
Reposting Rate |
The percentage of relevant job postings where the job was taken down and reposted within 2 weeks, during the selected date range. |
Average Fill Days |
The average number of days between the posting date and the estimated fill date*, across all relevant job postings. *Based on jobs closed and not reposted within two weeks of close date, monitored for accuracy. |
Monthly Job Summary...

The Monthly Job Summary is an area chart that summarizes job market activity month by month. The chart displays four key metrics:
-
Open Positions (New and Reposted)
-
Filled Positions
-
All Postings
-
Urgently Hiring Postings
Move your cursor across the chart to reveal the exact counts for each metric by month.
Top 10 Cities...
The Top 10 Cities table shows the top 10 cities with the most relevant job postings during your selected time frame.
Each city will populate as a row in the table, with the following columns:
City |
The name of the city. |
State |
The state of the city. |
Job Postings |
The total number of job postings in that city posted during the selected date range and matching any filters. |
Advertised with Compensation |
The percentage of the job postings where compensation/salary details were disclosed. |
Average Salary |
The average (Modified Mean) salary across the relevant job postings. |
Average Fill Days |
The average number of days between the posting date and the estimated fill date, across the relevant job postings. |
Click on any column header to rearrange or sort.
Hover over the section to reveal the 'Maximize' button in the upper right-hand corner for easier viewing. 
Top 10 Companies...
The Top 10 Companies table shows the top 10 companies with the most relevant job postings during your selected time frame.
Each company will populate as a row in the table, with the following columns:
Company |
The name of the company. |
Job Postings |
The total number of jobs posted by that company during the selected date range, and matching any applied filters. |
Advertised with Compensation |
The percentage of the job postings where compensation/salary details were disclosed. |
Average Salary |
The average (Modified Mean) salary across the relevant job postings. |
Average Fill Days |
The average number of days between the posting date and the estimated fill date, across the relevant job postings. |
Click on any column header to rearrange or sort.
Hover over the section to reveal the 'Maximize' button in the upper right-hand corner for easier viewing.
Job Status Distribution...

The Job Status Distribution is a pie chart breaking down the job statuses of the relevant postings within your selected date range. The three job statuses are:
- Filled: Posted and estimated to have been filled within the selected date range.
- Open: Jobs that were open for the entire duration of your selected date range.
- Repost: Jobs that were taken down and reposted within 2 weeks during the selected date range.
Remote Status Distribution...

The Remote Status Distribution is a pie chart breaking down the remote status of the relevant postings within your selected date range. The three remote statuses are:
-
Not Remote
-
Permanently Remote
-
Hybrid Position
Title Cluster Status Summary...
The Title Cluster Status Summary table shows the top relevant title clusters, with details on the postings (within the selected time frame) in each cluster.
If the Market+ Report is filtered by title cluster, only that cluster will show in this section.
See also: What are Title Clusters?
Each relevant title cluster will populate as a row in the table with the following information columns:
Title Cluster |
The Title Cluster, a grouping of similar job titles. |
All Postings |
The total number of jobs posted within that title cluster during the selected date range, and matching any applied filters. |
Filled Position |
The number of the postings that are estimated to have been filled within the selected date range. |
Open Positions (New + Reposted) |
The number of relevant postings that remained open throughout the duration of the selected date range, including any that were closed but reopened within 2 weeks. |
Reposting % |
The percentage of relevant job postings where the job was taken down and reposted within 2 weeks, during the selected date range. |
Urgently Hiring |
The number of relevant postings that were marked as 'urgently hiring.' |
Average Salary |
The average (Modified Mean) salary across the relevant job postings. |
Average Fill Days |
The average number of days between the posting date and the estimated fill date, across the relevant job postings. |
Job Title Summary... The The Job Title Summary table shows the top relevant job titles (not clustered) with details on the postings (within the selected time frame and matching any applied filters) for each title .
Each relevant title will populate as a row in the table with the following information columns:
Title |
The unique title of the job. |
All Postings |
The total number of jobs with that title posted during the selected date range, and matching any applied filters. |
Filled Position |
The number of the postings that are estimated to have been filled within the selected date range. |
Open Positions (New + Reposted) |
The number of relevant postings that remained open throughout the duration of the selected date range, including any that were closed but reopened within 2 weeks. |
Reposting % |
The percentage of relevant job postings where the job was taken down and reposted within 2 weeks, during the selected date range. |
Urgently Hiring |
The number of relevant postings that were marked as 'urgently hiring.' |
Average Salary |
The average (Modified Mean) salary across the relevant job postings. |
Average Fill Days |
The average number of days between the posting date and the estimated fill date, across the relevant job postings. |